Data Analysis Notebooks

Notebooks Preview

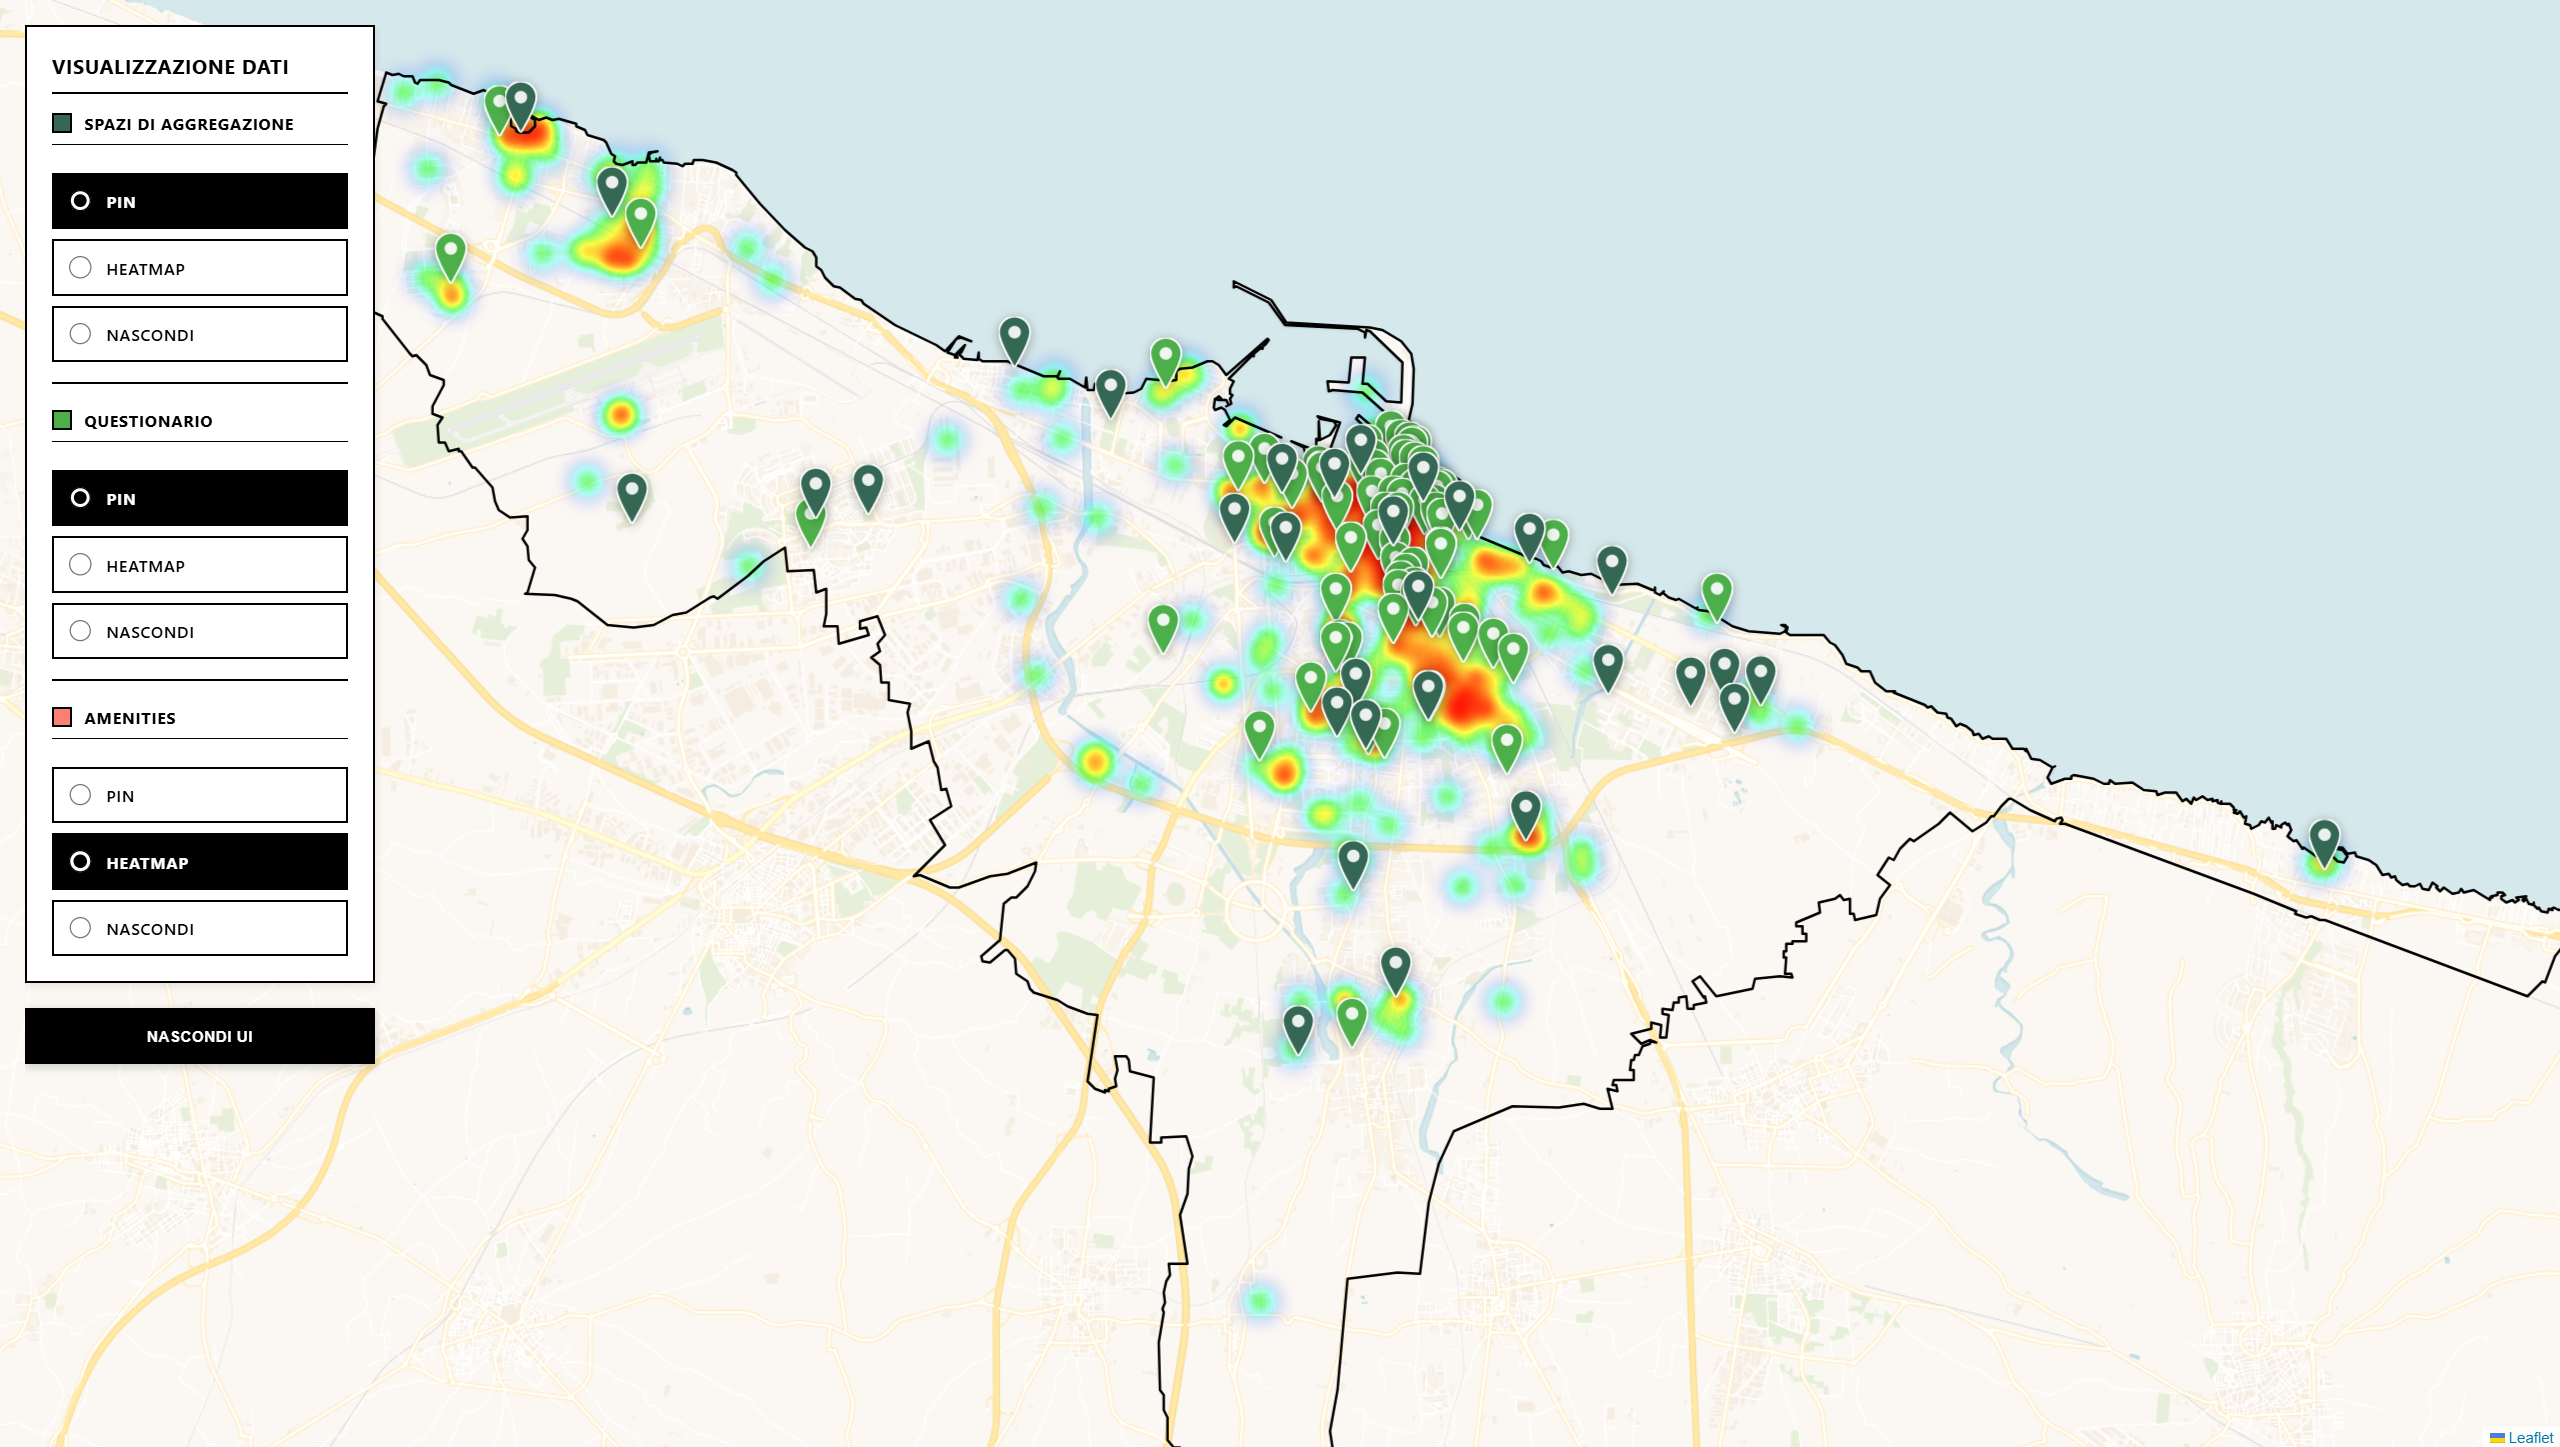
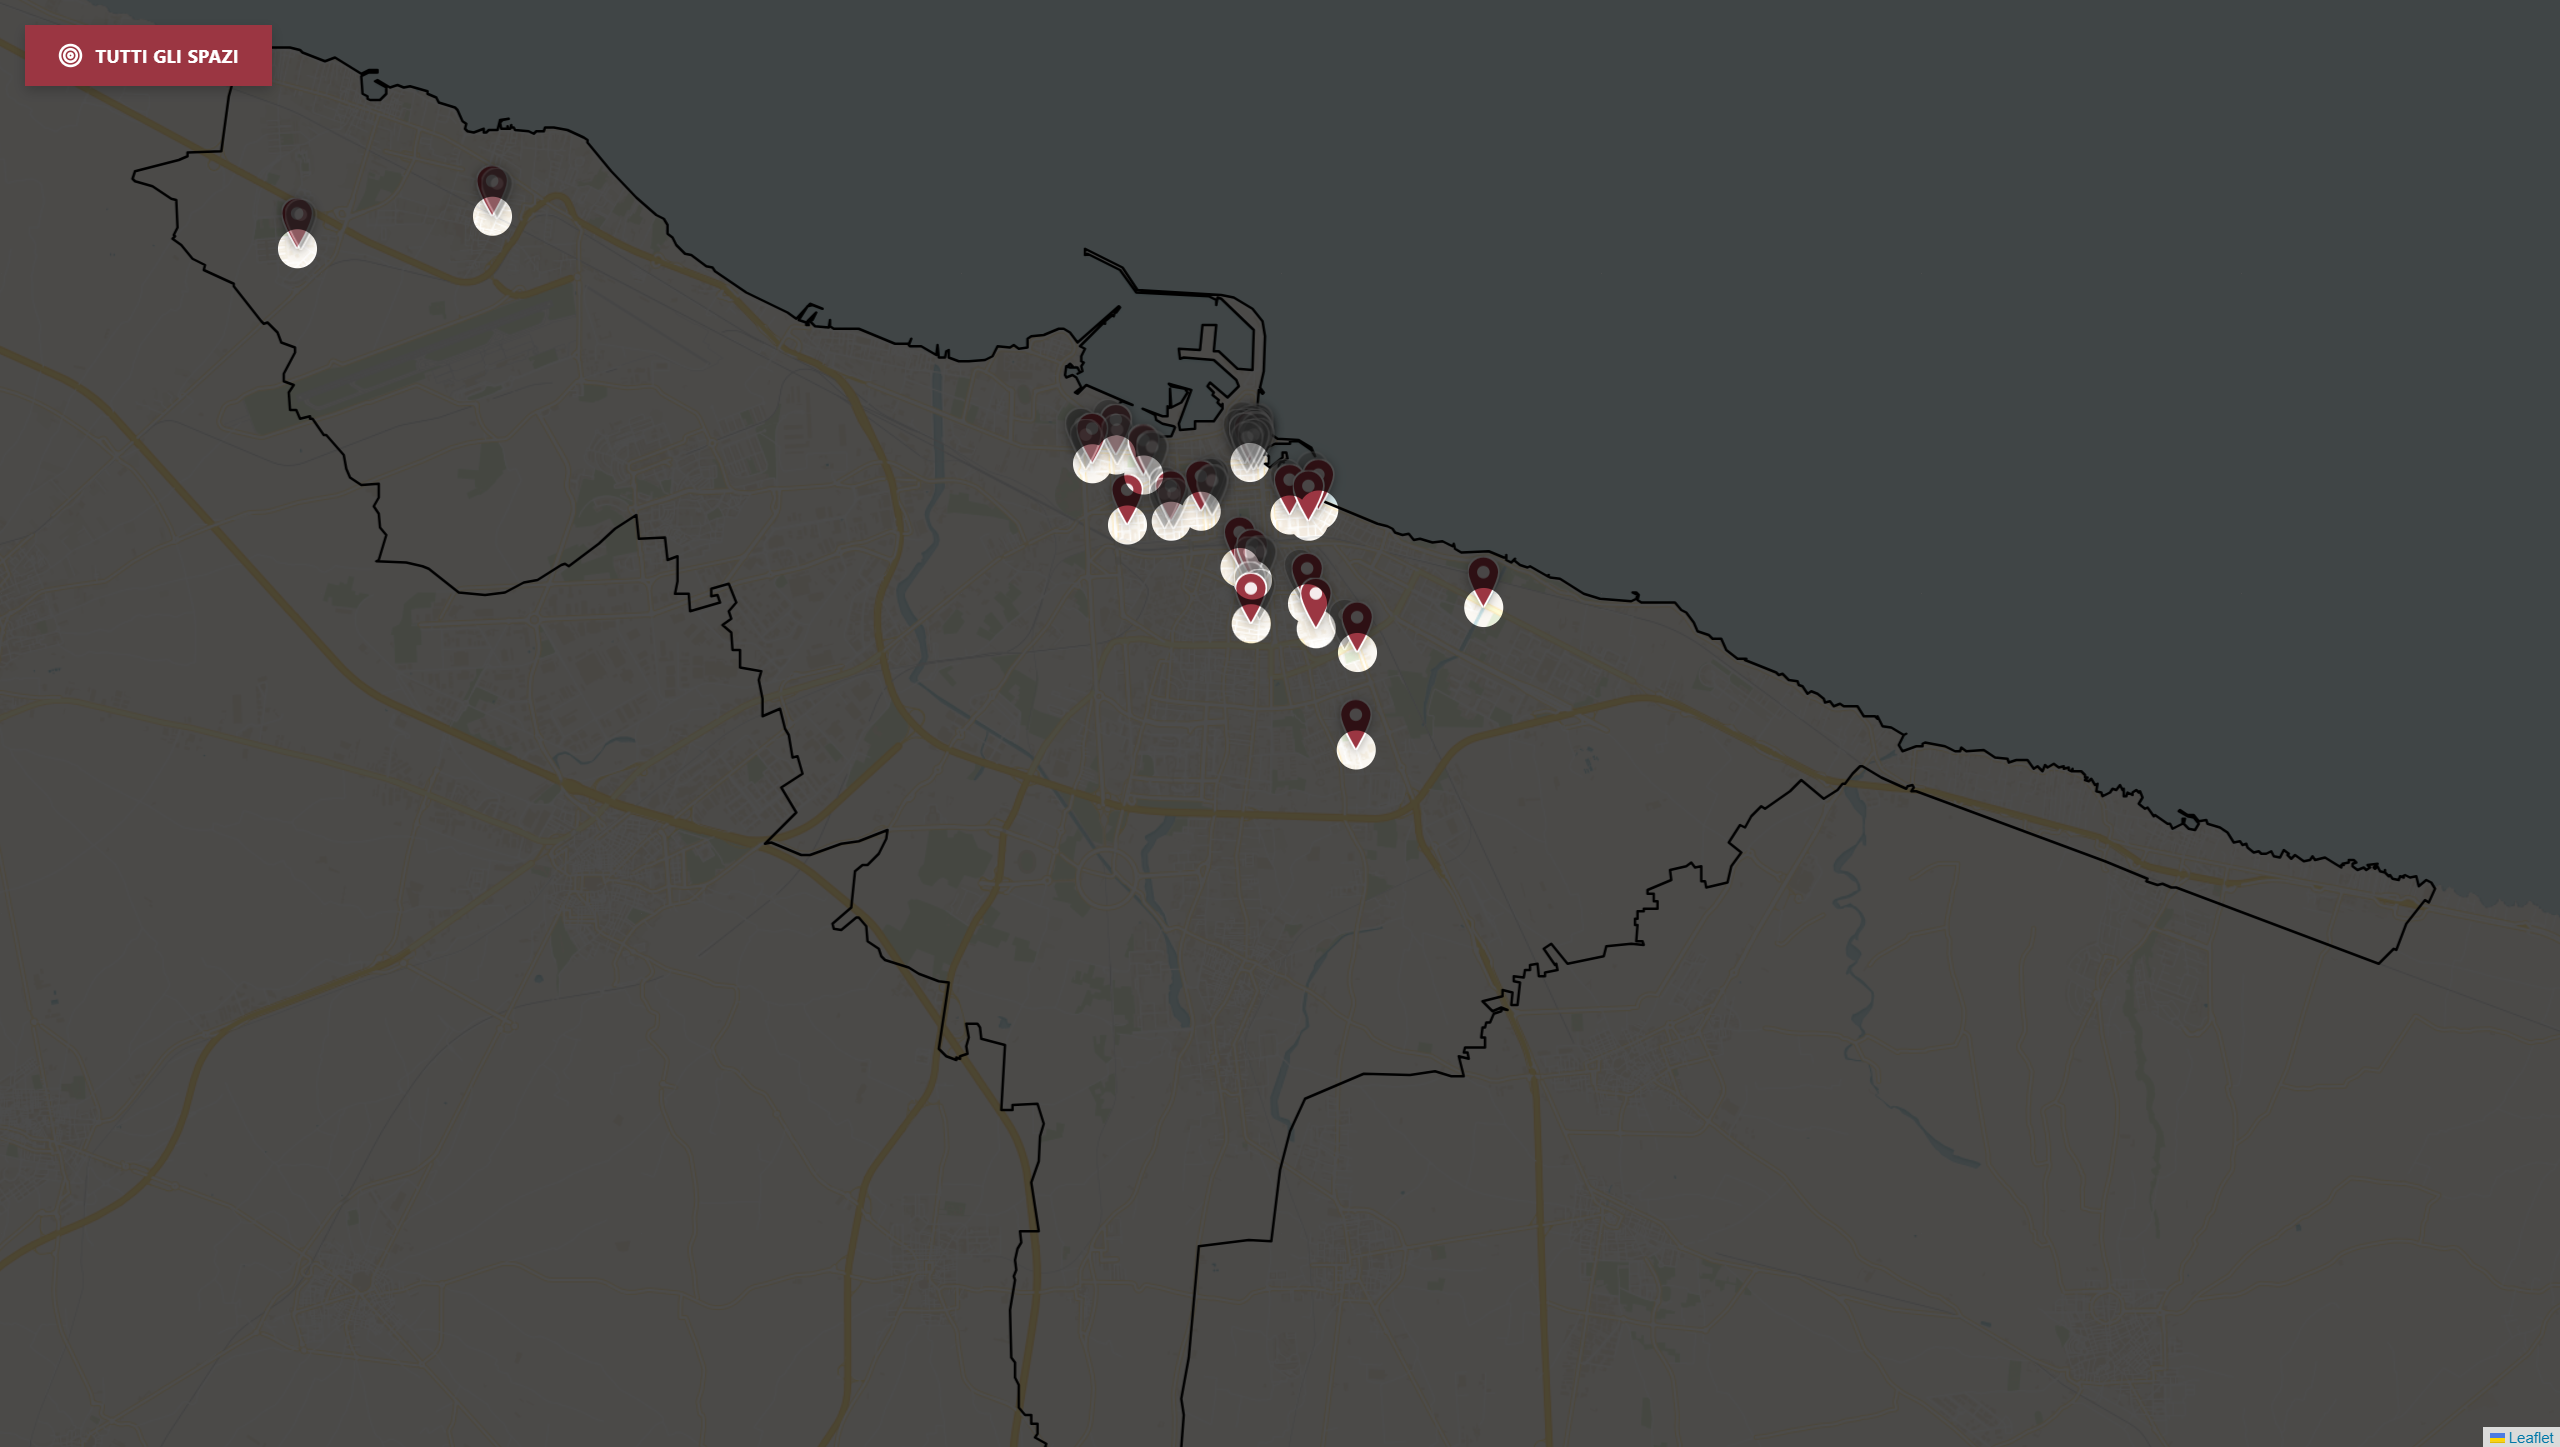
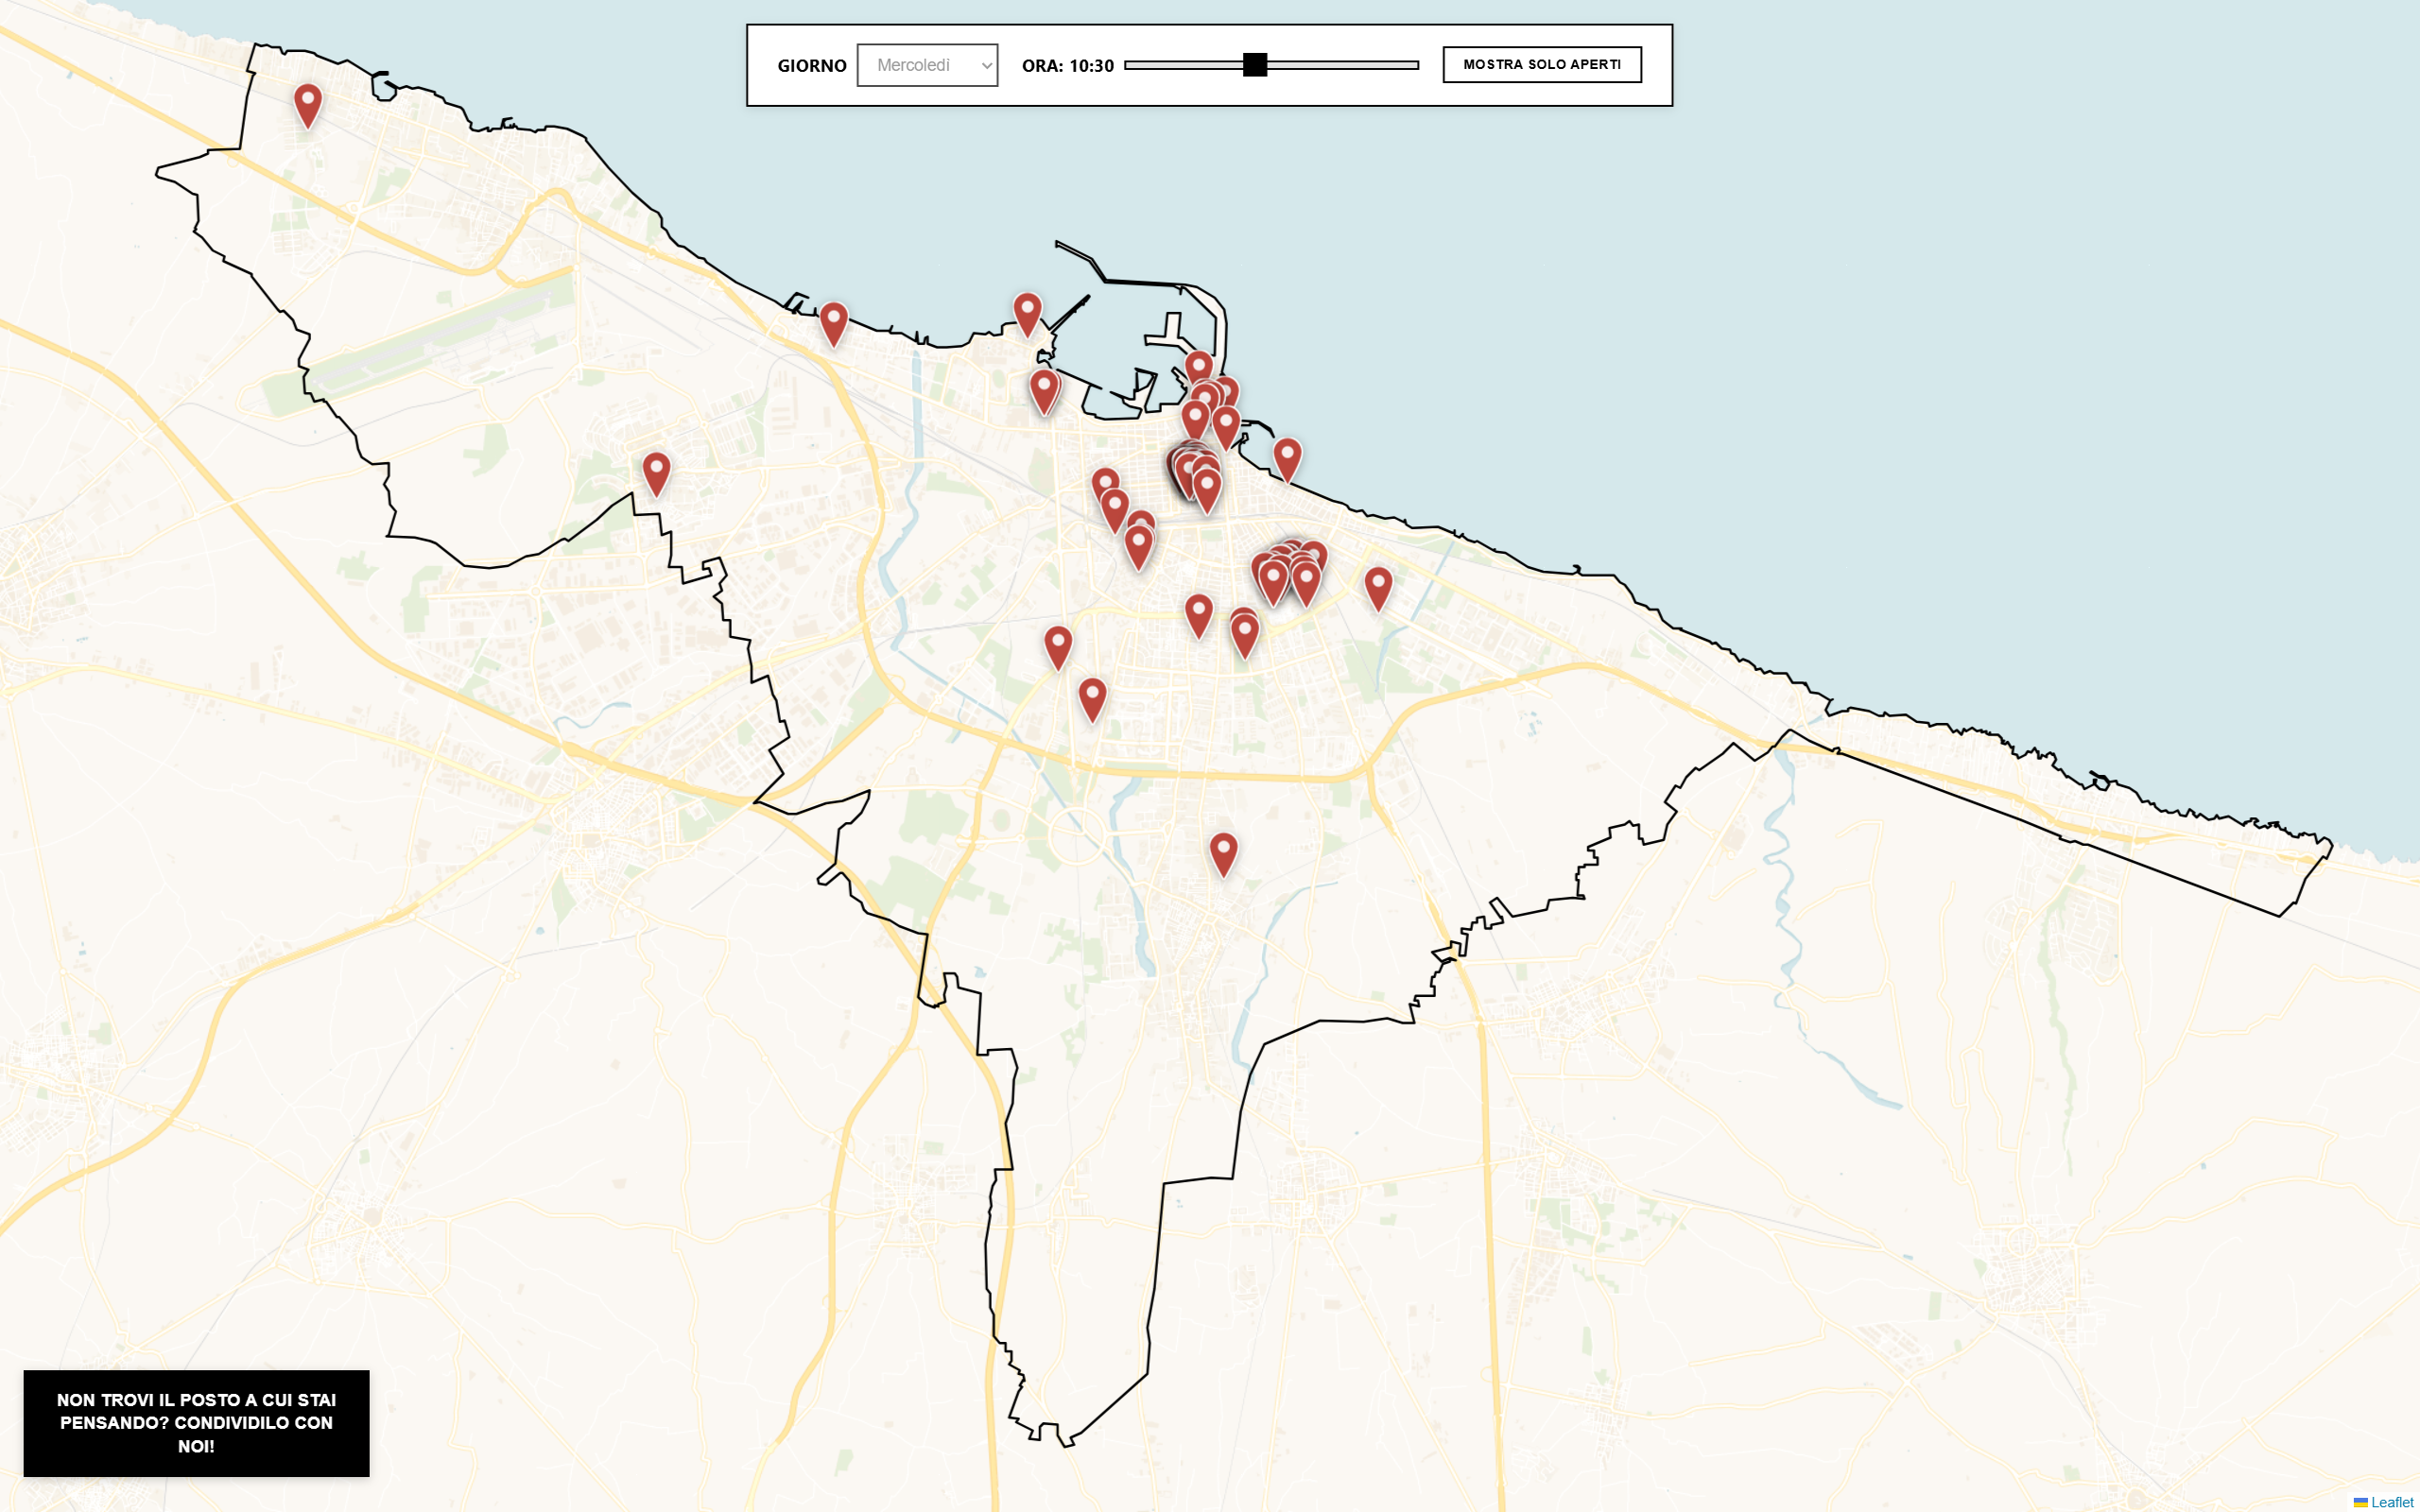
Comprehensive data processing pipeline for urban space mapping in Bari. The first notebook automates the transformation of geographic and institutional data from Excel spreadsheets into structured JSON datasets, extracting hyperlinks, parsing opening hours, and organizing spaces by category (aggregation, social struggle, and study spaces). The second notebook queries OpenStreetMap's Overpass API to collect Points of Interest (POIs) and amenities across Bari, using geometric operations to validate coordinates and enrich the spatial database. Together, these notebooks enable efficient data preparation and geographic enrichment for the interactive mapping visualizations, converting raw data and open-source geographic information into ready-to-use JSON files.

Aggregation Spaces

Aggregation Spaces Preview

Interactive multi-layer mapping platform for visualizing aggregation spaces, citizen-reported locations from questionnaires, and OpenStreetMap amenities across Bari. Features a modular architecture with three independently controllable data layers, each toggleable between pin markers and heat density visualization. Users can dynamically switch visualization modes through radio controls, explore individual locations with detailed tooltips, and view comprehensive information (including structured opening hours, categories, and coordinates) in a slide-out panel. Built with Leaflet.js and organized with ES6 modules, the platform includes UI hiding functionality, custom color-coded markers, polygon boundary overlays, and responsive design for analyzing spatial distribution patterns of social spaces throughout the city.

Social Struggle Spaces

Struggle Spaces Preview

Minimalist interactive mapping application focused on visualizing social struggle spaces in Bari through a spotlight interaction pattern. When clicking any location pin, the system generates a dynamic SVG overlay that darkens the entire map while creating a 150-meter radius circular cutout around the selected point, visually "spotlighting" that area and filtering nearby amenities. Features dual-layer architecture displaying social struggle spaces and OpenStreetMap amenities with distance-based visibility filtering, a multi-spotlight mode ("All places" / "All places") that simultaneously highlights all locations with multiple circular cutouts, real-time overlay updates during map zoom and pan. Built with Leaflet.js and modular ES6 architecture, emphasizing focused exploration over complex controls with a single-button interface for clean, distraction-free spatial analysis.

Study Spaces

Study Spaces Preview

Time-interactive mapping platform for discovering study spaces across Bari with intelligent availability filtering. Features a horizontal time control interface allowing users to select any day and hour to automatically filter locations by opening hours, with the system defaulting to current time and "show only open" mode on page load. Includes comprehensive opening hours parsing and display system showing structured weekly schedules with multiple time slots per day. Users can contribute new locations through a validated web form (name, email, description, address, functionality, capacity, links) that submits directly via Web3Forms API with real-time field validation and error handling. Built for students seeking available study locations, combining Leaflet.js mapping with practical scheduling utilities and community-driven content expansion through an accessible submission workflow.